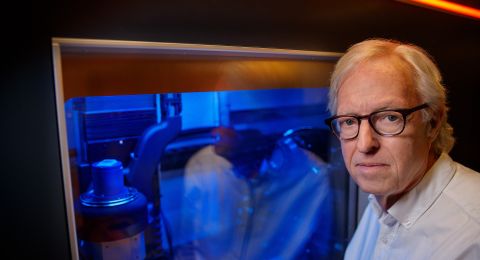
When researchers aim their instruments at the glittering stars of the Milky Way or the innermost parts of our cells, they capture huge amounts of information. Understanding and interpreting that information will require new ways of analyzing and illustrating it. Wallenberg Scholar Anders Ynnerman is forging the way toward a better understanding.
Anders Ynnerman
Professor of Scientific Visualization
Wallenberg Scholar
Institution:
Linköping University
Research field:
Scientific visualization
Cutting-edge research uses advanced techniques and methods to generate enormous amounts of data. In this huge mass of data it can be difficult to find and highlight correlations between different data points. Finding ways to illustrate complex data in multiple dimensions in a way people can understand is just as difficult.
“These days we have large archives and databases, physical sensors and agents. All of them generate enormous data streams. We need ways of reducing them to create visual representations – preferably in the form of interactive image streams, because people love those,” says Ynnerman, who is professor of scientific visualization at Linköping University and a Wallenberg Scholar.
He is researching to find ways of processing and managing information to make it manageable and easy to understand. The path to new ways of navigating multidimensional datasets goes via Californian wines, among other things.
Californian wines
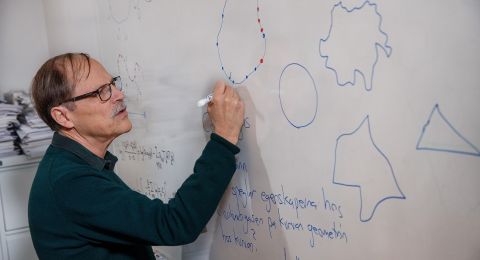
To process multidimensional data, they must first be reduced to fewer dimensions using a process called dimensionality reduction. Ynnerman has developed methods to create abstract, mathematical representations of large datasets. The test sets the researchers are using include a simple example containing a wealth of information about wines from California. The dataset includes chemical analyses of different wines to describe the multidimensional flavors that give the wines their characteristics.
“It's about finding common factors among the various types of wine. To succeed, we need to use machine learning and develop new algorithms that can form the basis for improved understanding through visualization.”
The lessons learned from visualizing the complex flavors of wines are then used to make similar analyses of a wide range of information, from genetic data to the information captured by space telescopes.
The time factor
Visualizations are often created from static data. But when the dataset forms the basis for an animation, the time factor must also be included. New ways of processing data streams are needed when each frame in the animation is based on several terabytes of data.
“We have used various hierarchical structures to reduce the data that must be transmitted to create interactive animations and image streams.”
These structures use the relationship between time, distance and the volume of information required. One example is moving weather maps that show weather patterns. New information is needed every minute to show clouds passing over a city. But for a larger region, changes occur more slowly. And cloud formations over continents hardly move at all from one day to the next.
“The more zoomed out you are, the sparser the sequence of events becomes. We can take advantage of this by only loading the data required for each situation,” says Ynnerman.
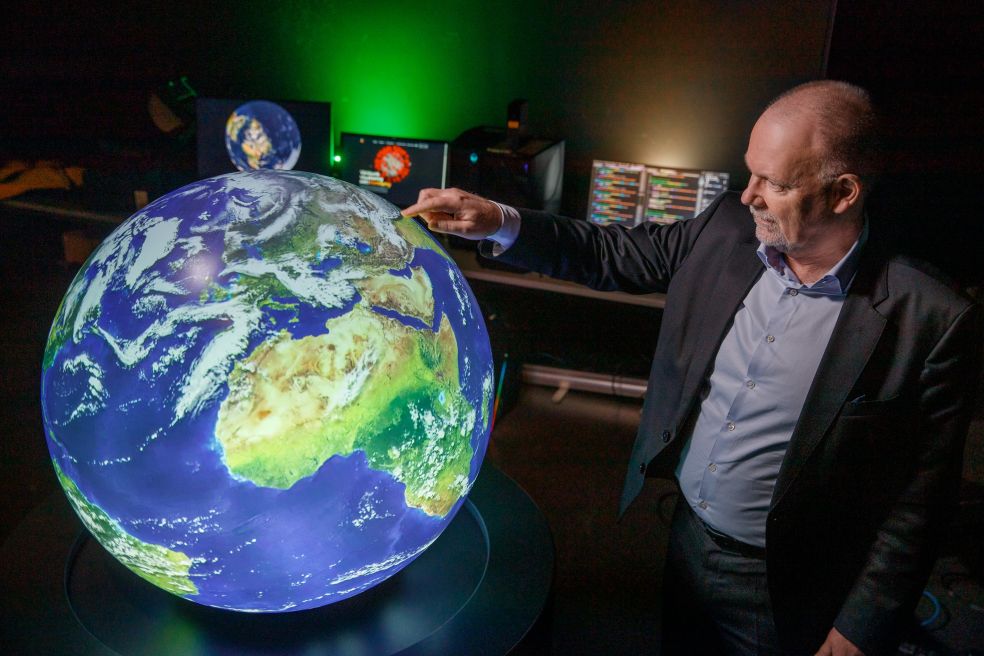
Working side-by-side with the public
He welcomes us to the large Visualization Center C in the city of Norrköping. Since 2010, the center has served both as a research environment and a public arena for visualizing science and knowledge. Ynnerman is one of the instigators, with research taking place side-by-side with the development of new visualization technology.
One of the coolest things right now is the use of generative AI in visualization. It enables us to have a human dialogue with the abstract. This will impact both how we use educational materials and the workflow in most professions.
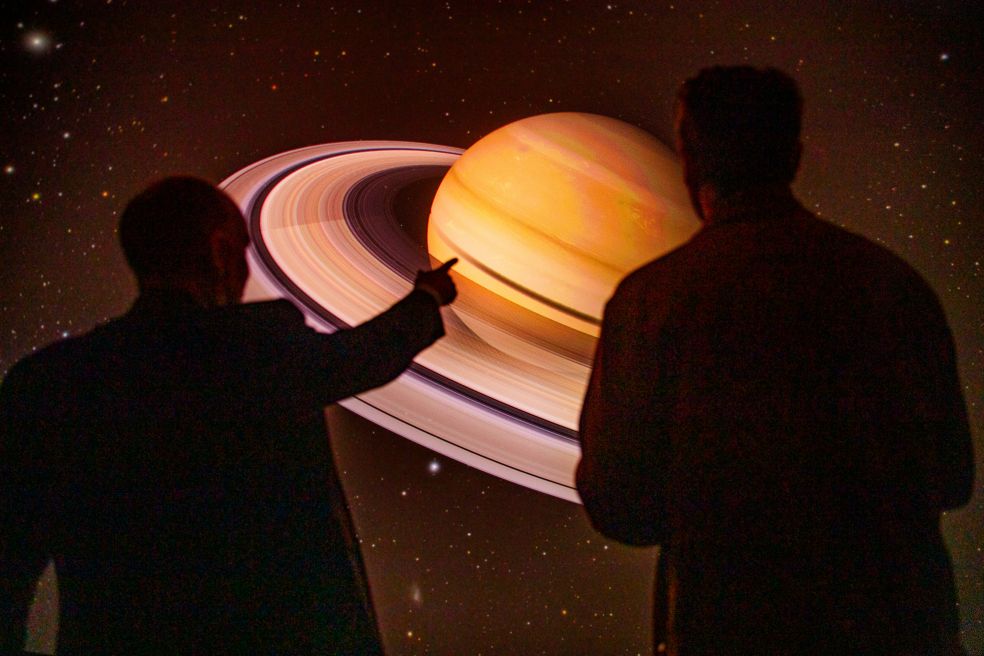
At the center, visitors can explore everything from microscopic organisms to distant galaxies by interacting with exhibitions and environments.
“Visualization as a medium facilitates something very human: to see things together and solve problems collectively.”
The Center is also the hub for a national initiative called WISDOME – Wallenberg Immersive Science Communication Domes, which has established dome theaters at Malmö Museum, Universeum in Gothenburg, the National Museum of Science and Technology in Stockholm, and Curiosum at Umeå University. All are modeled on the dome in Norrköping. Ynnerman is the director of the consortium and works with his team to develop content for all the theaters.
He hopes to further enhance the visualizations using the latest developments in generative AI. As well as being able to interact in various ways with the technology, it should be possible to communicate with the underlying systems.
“We have created a visualization of the corona virus, for instance, where you can examine it visually at different resolutions and put your own questions to the virus. The system then responds using a combination of visual and verbal communication.”
Eventually, the ability to talk to the technology will be integrated into all exhibitions at the Visualization Center.
“Many of the installations will be equipped with some form of intelligence – rather like a virtual museum guide you can talk to during your visit.”
But he also emphasizes the importance of the human perspective in both research and technological developments.
“We don’t want to replace all museum guides with AI but rather enhance the experience for visitors. A human guide will always be better than our system. But a human together with a system of this kind offers the very best of both worlds.”
One task facing the team is to identify where in the chain AI can make a difference.
“One of the flaws in human perception is that we are highly conditioned to look for what we recognize. AI can help us see patterns, raise the level of abstraction, and even describe it in words and images we can understand.”
Text Magnus Trogen Pahlén
Translation Maxwell Arding
Photo Magnus Bergström